Input and settings view
This topic describes the purpose of the Sentinel screen's Input and settings view and all the settings and buttons on it.
This feature requires option E14 Sentinel. If you do not have this option this feature is not available.
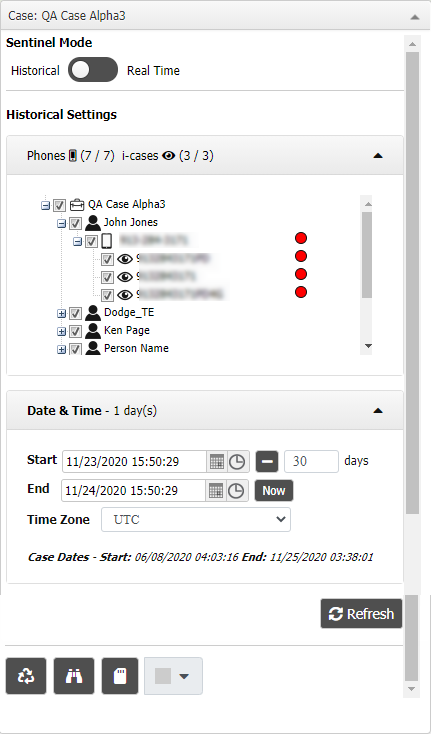
The Input and settings view allows you to define what information is displayed on the Sentinel screen. It allows you to select whether you want to view historical or real time data, which CASEID (LIID) you want to view, and the time period of interest. There are also a number of icons that allow you to manage the Sentinel screen, refer to Settings and buttons for further information.
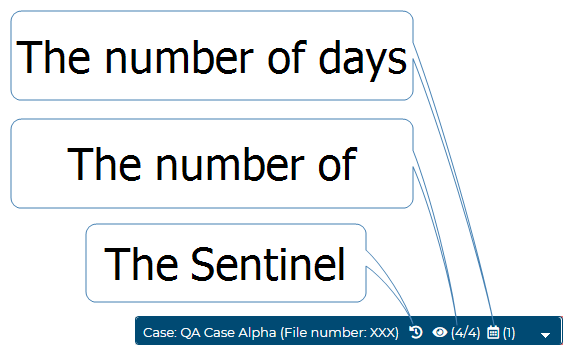
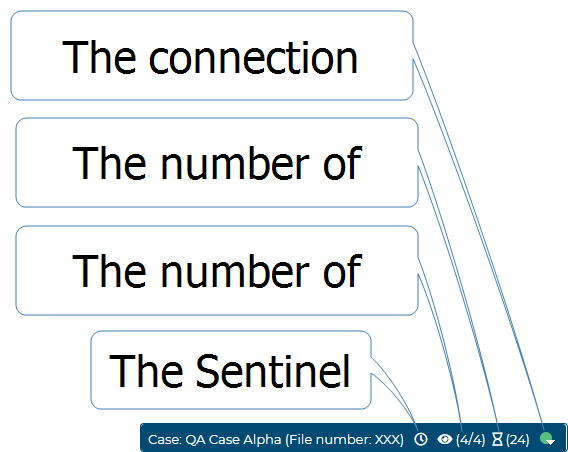
What displays on the Input and settings view depends on which Sentinel Mode you have selected. The view once configured can be minimized in size using the arrow on the top-right so that only the case name and a summary of what is selected is displayed. It can be re-opened again using the arrow on the top-right.
-
Historical mode (open and minimized):
-
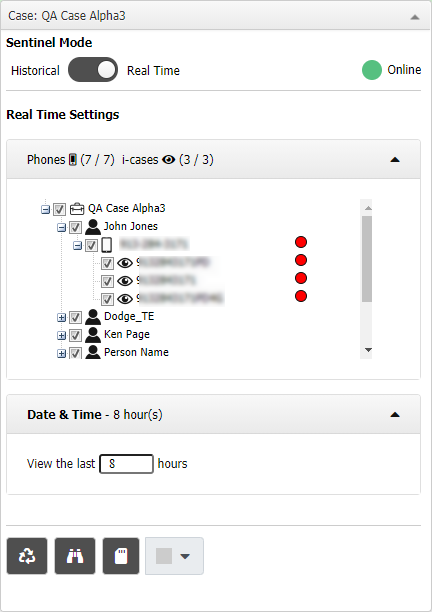
Real time mode (open and minimized):
NOTE: If your Sentinel screen disconnects unexpectedly it may be due to your Web browser settings. For information on resolving this issue refer to How to stop Sentinel disconnecting.
Select whether you want to view historical data, or monitor the most recent real time surveillance data as it occurs. You can define the time period for each mode using the Date & Time settings.
The two different Sentinel modes which control what is displayed on the Sentinel screen are:
-
Real Time: allows you to monitor the messages as they occur, including some history up to 24 hours. This allows you to monitor a person's current and recent movements and activities. The person's movements appear on the map as they occur. The person's last known call location is marked with a moving straight line
 . If the most recent location is a sector with no azimuth defined then this straight line is displayed moving over 360 degrees. The person's current activities are marked with moving curved lines
 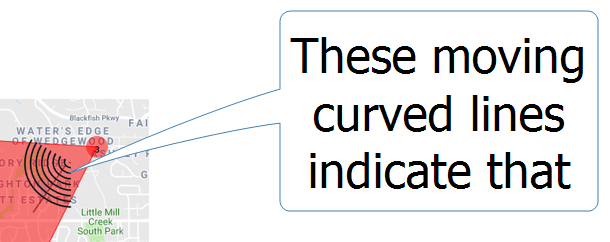 . If the current activity locations is a sector with no azimuth defined then these curved lines are displayed over 360 degrees. Current activities are defined as:
 - a call or data session in progress. Note, that the map displays all the sectors that have been used during the call, not just the call's latest sector. The sector that is currently being used is displayed like this , whereas the previous sectors show no moving curved lines.
- an SMS that occurred in the previous 60 seconds.
- GPS pings that occurred in the previous 60 seconds.
Previous GPS ping locations and used sectors are also displayed on the map. For further information refer to Monitoring movement on the Sentinel screen.
- a call or data session in progress. Note, that the map displays all the sectors that have been used during the call, not just the call's latest sector. The sector that is currently being used is displayed like this
-
Historical: allows you to select the timeframe to manually analyze the data. This mode is the same as real time without real time updates.
This mode can also be useful to law enforcement agencies if they wish to export the original data sent by the operators over a specific date range to include in your case files.
For further information refer to Verifying you are sending the requested data.
When you are in real time mode this circular status icon informs you whether or not your Web browser is in an active Web session and the quality of it. The status icon changes in color depending on the following:
- Red: your connection with OSS-ESPA was totally lost and new incoming data is not displayed.
- Yellow: your connection is temporarily slow and new data may be delayed in being displayed.
- Orange: your connection was lost and OSS-ESPA is trying to reconnect you.
- Green: you are connected with OSS-ESPA and new incoming data is displayed.
This displays all the people, phones and CASEID (LIID) for the case. Select which ones you want to retrieve the data for. The data associated with these is then populated on the screen's map and views. By default the ones that are initially selected are dependent on where you opened the Sentinel screen from, for example if you opened the Sentinel screen from a specific phone number then only that phone number and its CASEID (LIID) will be selected by default. The surveillance data is only retrieved for those that are selected and during your specified date and time.
If you change any settings you must click Refresh to update the Sentinel screen.
If the i-case associated with the phone is either disabled or no longer valid it will display as  .
.
The settings displayed in this group are dependent on which Sentinel Mode you selected.
This setting is only applicable if Sentinel Mode is set to Real time. Select the previous number of hours that you want to view, for example, you may want to select one hour if you only want to monitor the most recent surveillance data as it occurs. The oldest data is removed from the screen when it becomes outside of the selected time period. The maximum and default value is 96 hours (4 days). After changing this setting you must click Refresh.
Note, once the surveillance data is displayed you can also further filter it using the filter on both the map and the Location events view. For further information refer to Filter.
These settings are only applicable when Sentinel Mode is set to Historical. They are automatically completed with the End date being your current date and time and the Start date being 24 hours prior to that. The date and time of the earliest and latest surveillance data in the case are also displayed for your convenience. Select which time interval you are interested in analyzing the surveillance data over.
- To set the End date either use the date/time picker or click Now to select the current date.
- To set the Start date either use the date/time picker or select the number of days you want then click
 .
.
These settings are only applicable when Sentinel Mode is set to Historical. Select the timezone you want all the times to be displayed in. You can set the time zone selected by default using the My default time zone and format for displaying date and timestamps in views and reports on the Sentinel user preference screen.
Click to retrieve and display the data based on what you selected in Phones and Date & Time.
 Reset layout
Click to return the current configuration of the Sentinel screen to the factory layout settings, that is the original layout of the views the first time you used the screen. This does the same as the Reset layout on the Sentinel user preference screen.
 Views
Views
Click to open the Views dialog box which allows you to define which views you want displayed on the Sentinel screen. It also allows you to define the default number of rows on the views.
 Save layout
If you have changed the views': column visibility settings, column order, column filters, sorting, and grouping and want to restore them to your preferred settings which you have previously saved using then click  . For further information refer to Using basic features of the Sentinel screen views.
 Color
Color
Select a color to apply to the borders of all the views. This is useful if you are monitoring multiple cases and you are opening views in new windows. It means you can easily identify which views are for which case based on their color.